


Customer acquisition cost (CAC) has risen by 40 to 60% since 2023, according to several converging sector analyses. This increase affects every industry, but it hits e-commerce and B2B SaaS especially hard, two worlds where profitability rests on a fragile balance between acquisition cost and customer lifetime value. The causes are structural: ad inflation, less precise targeting, longer buying cycles. The good news: these causes can be diagnosed, and concrete levers make it possible to regain control.
A note on currencies: the vast majority of sector market studies on CAC are published in US dollars (USD). In this article, all benchmarks are expressed in Canadian dollars (CAD) at an approximate rate of 1 USD = 1.37 CAD (June 2026), with the original source noted. These conversions are orders of magnitude and are no substitute for a calculation based on your own data.
Note: benchmarks from international sources in USD, converted to CAD at an approximate rate of 1 USD = 1.37 CAD (June 2026). These figures are orders of magnitude; your real CAC depends on your industry, your sales model and your acquisition channels.
CAC in 2026: a number many companies still calculate incorrectly
Before diagnosing why your CAC is rising, you first have to calculate it correctly. Most companies underestimate their real acquisition cost, which skews every decision that follows.
The full formula: what people forget to include
The basic formula is simple: CAC = (marketing spend + sales spend) / number of new customers acquired. But in practice, many line items are left out. Partial salaries for marketing and sales teams, tool and software costs, agency fees, management time: all of it is part of the real acquisition cost.
A concrete example: an SMB that spends 6,850 CAD on advertising and acquires 50 customers shows an apparent CAC of 137 CAD. But if you add 4,100 CAD in partial salaries, 1,100 CAD in CRM tools and 1,650 CAD in agency fees, its real CAC exceeds 275 CAD. The difference is decisive when compared against the margin per customer.
Watch out: Do not confuse CAC, CPL (cost per lead) and CPA (cost per action). CAC covers the entire journey up to the signed customer, including the exchanges and the close of the sale. A low CPL does not guarantee a controlled CAC if your conversion rate is weak.
Blended CAC vs CAC by channel: why the difference changes everything
Blended CAC divides total spend by all new customers, across all sources. It is easy to calculate but misleading: it mixes your low-cost organic customers with your very expensive paid customers, masking the real inefficiencies.
CAC by channel isolates each acquisition source. A typical result: your Google Ads CAC is around 410 CAD, your organic CAC reaches 205 CAD over the year, and your direct CAC caps out at 70 CAD. Without this breakdown, you have no precise optimization lever. In 2026, paid CAC is on average 2.4 to 3.1 times higher than blended CAC, because organic and direct channels pull the average down.
Pro tip: Apply a time lag in your calculations. In B2B SaaS, a customer who signs in March is often the result of marketing efforts deployed in September or October. Matching a month's spend to that same month's customers produces a distorted CAC. Align acquisition cohorts with your industry's real buying cycles.
2026 benchmarks by industry: where do you stand?
Sources: ChartMogul + OpenView SaaS Benchmarks 2026; First Page Sage Average CAC 2026; Userpilot CAC Benchmarks 2026. Converted to CAD at a rate of 1 USD = 1.37 CAD (June 2026).
Ad saturation: when Google and Meta cost more and more
The most direct cause of rising CAC is the inflation of advertising costs. On Google Ads and Meta Ads, the cost of every impression, click and conversion has risen significantly. This trend is not cyclical: it is structural.
Meta Ads in Canada: CPM around 18 to 25 CAD in 2026
For Canadian advertisers, the Meta CPM (cost per thousand impressions) sits between 18 and 25 CAD in 2026, a 12% year-over-year increase for Tier 1 markets, which include Canada. For comparison, the global average CPM is around 9 CAD.
The average CPC in Canada sits around 0.75 to 1.10 CAD according to Shopify and advitam.ca (2025-2026). For Quebec SMBs, these costs are sometimes slightly below the national average, due to less intense competition on certain segments. But the underlying trend remains upward.
As for CPA (cost per acquisition), the increase is even sharper. Globally, the average Meta CPA across all industries jumped by 38% in one year worldwide, rising from about 38 to 52 CAD in Canadian equivalence. For the fashion and beauty sectors, the increase reaches 20 to 30%.
Sources: advitam.ca, Facebook advertising prices Canada 2025; AdAmigo.ai, Meta Ads CPM benchmarks by country 2026; get-ryze.ai, Meta Ads Cost Benchmarks 2026. Conversions to CAD at a rate of 1 USD = 1.37 CAD.
Google Ads in Canada: CPC of 3 to 35 CAD depending on the industry
On Google Ads, the average CPC in Canada hovers around 3 CAD across all industries, according to mylittlebigweb.com. But this order of magnitude hides enormous gaps by sector: from less than 1.50 CAD in niche e-commerce to more than 35 CAD in legal or financial services.
An important detail for Quebec companies: according to The Churn (brandbutter.ca, April 2026), French-language campaigns often show lower CPCs and higher conversion rates than English campaigns in Quebec and in bilingual markets. This is a real opportunity for brands that operate in French: less competition on the bids, for a more qualified audience.
The average CPC on the Search network has risen by about 9 to 12% over the past two years, driven by increased competition and the widespread adoption of Performance Max campaigns, which push costs up in competitive markets.
Sources: mylittlebigweb.com, Google Ads campaign cost 2026 (Canada data); brandbutter.ca, Google Ads in Canada 2026; sodigix.com, Google Ads CPC 2026.
The end of easy targeting: privacy, iOS and the end of third-party cookies
Behind ad inflation lies a deeper, often underestimated cause: the degradation of targeting precision. The gradual disappearance of third-party cookies and the tightening of privacy rules have forced algorithms to work with less data, at your expense.
What the end of cookies really changed in your campaigns
Third-party cookies made it possible to track a user from one site to another, identify their interests and target audience segments with surgical precision. That capability has been sharply reduced by Apple's restrictions (iOS 14+), Law 25 in Quebec and Google's decisions on Chrome.
Direct consequence: algorithms have to “feel their way” more before finding conversions. They expose your ads to less qualified profiles before identifying the right segments. This learning time is paid for in extra budget without conversion, which mechanically inflates the CAC.
Watch out: In Quebec, Law 25 on the protection of personal information imposes strict obligations on the collection and use of data. Several companies have had to rework their ad tracking, which temporarily degraded their campaign performance and drove up their CAC. If your implementation is not compliant, you risk not only fines but also a loss of signal in your Meta and Google campaigns.
The concrete impact on e-commerce and B2B SaaS
In e-commerce, ultra-precise retargeting was long the most profitable lever. Abandoned carts, product-page visitors, lookalike audiences built on behavioral data: all of it has degraded. Retargeting campaign conversion rates have dropped by 15 to 25% depending on the industry, which weighs directly on the CAC.
In B2B SaaS, the impact is different but just as real. The “hidden journey” (the part of the buying journey invisible to classic attribution tools) now represents up to 70% of the decision path before a prospect fills out a form. Teams that rely solely on last-click massively underestimate the real acquisition cost.
First-party data: the strategic asset few SMBs have truly built
The structural answer to the end of cookies is first-party data: your email lists, your CRM data, your customers' behavior on your own platform. This data does not depend on any external algorithmic change.
Companies that invested in their data starting in 2022 see their advertising CAC stabilize where their competitors see it explode. It is not a question of budget: it is a question of long-term strategy.
It is probably the most technical element to put in place, but one of the most important. That is why we offer this service to every Quebec company that wants to set up a server-side GTM.
E-commerce: when CAC exceeds the profit on the first order

E-commerce is the industry where the pressure on CAC is most visible, because margins are thin and repeat-purchase cycles are variable. In 2026, the reality is uncomfortable: for many Canadian online stores, every new customer acquired through paid channels generates a net loss on the first transaction.
The numbers that hurt: average CAC and first-order margin
The average e-commerce CAC sits around 93 CAD for business-to-consumer (B2C) and 115 CAD for business-to-business (B2B). For a fashion or accessories store with an average cart of 80 to 110 CAD, gross margins after production and shipping are often around 30 to 40%. The net margin on the first order is therefore, very often, negative or nil.
Google Shopping CPCs jumped by 33.7% in 2025 worldwide, and Meta CPM in Q4 2025 reached an average of 31.45 CAD. Continuing to optimize only the top of the funnel (more traffic) in this context is filling a leaky bucket.
Sources: retainful.com, Customer Acquisition Cost in Ecommerce 2026; First Page Sage, Average CAC for eCommerce Companies 2026. Amounts converted to CAD at a rate of 1 USD = 1.37 CAD.
Watch out: Do not confuse acquisition CAC and retention CAC. Re-engaging an existing customer costs 5 to 7 times less than acquiring a new one. The companies with the best LTV/CAC ratios are not the ones that spend the least on acquisition: they are the ones that keep their customers the longest.
The “more traffic” trap in a poorly converting funnel
Many e-commerce leaders react to rising CAC by increasing their advertising budget. This is precisely the opposite of what should be done first. A poorly optimized conversion funnel means that every extra dollar invested in advertising produces proportionally fewer customers.
A conversion rate that goes from 1.5% to 3% on a landing page cuts your CAC in half on that channel, without changing a single dollar of media budget. Conversion is the most underused lever in e-commerce.
The elements that most degrade conversion rates and inflate CAC:
- Loading speed: every extra second reduces the conversion rate by 4 to 7%.
- An overly long buying journey: long forms, forced account creation, friction at checkout.
- Lack of social proof: no verified reviews, testimonials or guarantees.
- Message-page mismatch: the ad's promise does not match what the visitor finds on arrival.
LTV (Customer Lifetime Value) as the only truly sustainable answer
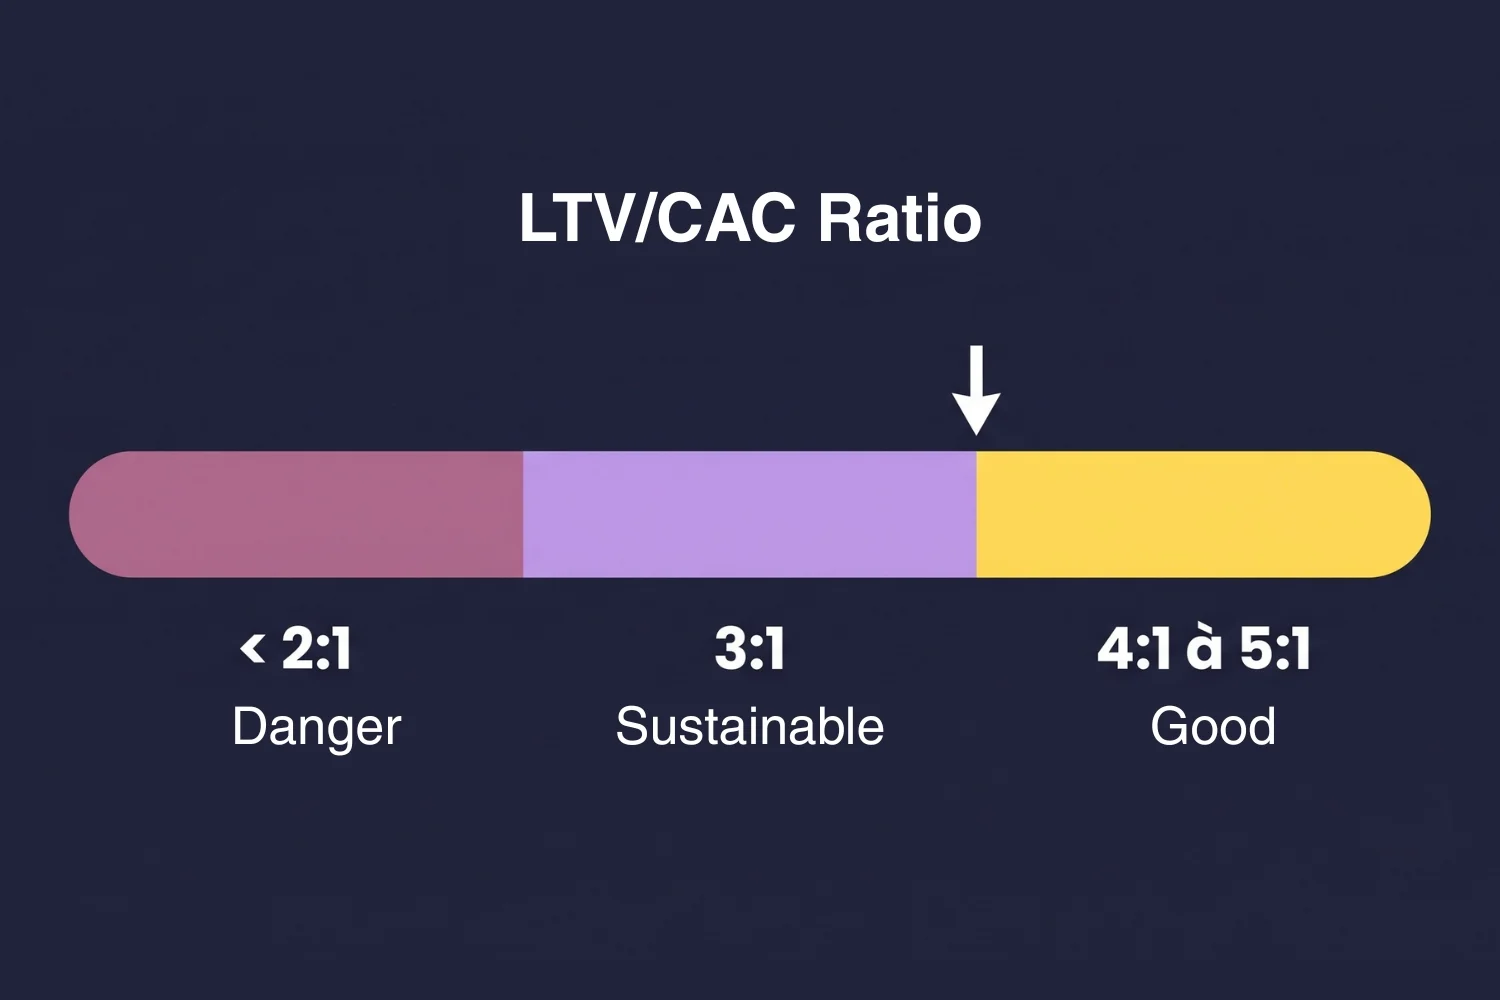
The LTV/CAC ratio is the real health indicator of an e-commerce model. A CAC of 115 CAD is perfectly viable if your average customer buys 4 times a year for 3 years and generates an LTV of 550 CAD. It is catastrophic if that same customer buys only once.
The target in e-commerce: an LTV/CAC ratio of 3:1 minimum. A customer who stays two years instead of one doubles the LTV without the CAC moving by a single dollar.
Pro tip: Segment your CAC by acquisition source AND by customer cohort. You will probably discover that your customers acquired through SEO or referral have an LTV 30 to 50% higher than those acquired through paid advertising, for a CAC 2 to 3 times lower. This calculation often justifies a massive reinvestment in organic content.
B2B SaaS: longer buying cycles, more cautious decision-makers
The B2B SaaS sector faces a rise in CAC that is not only due to advertising costs. It is also structural: buyers have become more cautious, validation processes have lengthened and each contract involves more stakeholders.
SaaS CAC: a 14% rise in one year and a 16x gap between models
The average B2B SaaS CAC has risen by 14% since 2025. The median across all channels sits around 1,645 CAD. But this figure hides enormous gaps.
Why buying cycles are lengthening and what it really costs
In B2B SaaS, buyer caution is a rational response to years of unfulfilled promises from poorly implemented tools. Decision-makers now involve more departments in the evaluation, demand more solid proof of ROI impact, and lengthen pilot periods before signing.
The average B2B SaaS buying cycle exceeds 134 days, compared to 107 days in 2022. Every step of this cycle has a cost: content to feed the decision, demos that mobilize salespeople, follow-ups, pre-sales support. These costs are often absent from teams' CAC calculations, which skews the diagnosis.
Source: GTM 8020, 38 Customer Acquisition Cost Statistics for B2B SaaS 2026.
5 concrete levers to reduce your CAC without sacrificing growth
Diagnosing the rise in CAC is necessary. Acting on it is urgent. Here are the levers that produce measurable results, in order of long-term impact.
Organic traffic: a CAC that collapses over time
Organic traffic has a unique characteristic among all acquisition channels: its CAC decreases over time. The initial investment (content creation, technical optimization, authority building) is real. But pages that rank keep generating qualified traffic for months, even years, at no additional marginal cost.
Improving the conversion rate: the fastest lever
It is mathematical: doubling your conversion rate halves your CAC, without changing your media budget. Most companies optimize the wrong variable: they increase ad spend rather than improving what happens after the click.
The actions to prioritize:
- Dedicated landing pages: one ad = one specific landing page, not the homepage.
- A/B tests on CTAs and headlines: simple variations can improve conversion by 15 to 30%.
- Social proof: customer testimonials, quantified results, logos of recognized clients.
- Speed and mobile: beyond 3 seconds of load time, you lose a significant share of your mobile visitors.
Segmentation and first-party data: target less to convert more
Targeting that is too broad generates clicks that do not convert, which mechanically inflates the CAC. Precise audience segmentation, fed by your first-party data, makes it possible to focus the advertising budget on profiles that resemble your best customers.
In practice: build lookalike audiences from your customers with the highest LTV. These audiences systematically outperform broad or demographic audiences. The data that feeds this segmentation comes from your CRM, your purchase history and your email database.
Retention as an anti-CAC weapon: when LTV does the work
The best way to make a high CAC bearable is to increase the value of each acquired customer. Retention acts indirectly on the CAC by increasing the LTV without spending an extra dollar on acquisition.
A loyalty program, proactive follow-up, account expansion: every retention action directly improves the ratio.
AI and automation: the lever widening the gap between companies
Companies that have integrated AI into their acquisition funnel are starting to show measurable results.
Rising CAC: the companies that act now build a lasting advantage
The rise in CAC in 2026 is not a cyclical anomaly. It is the result of a convergence of structural forces: ad saturation, loss of targeting precision, longer buying cycles, increased competition across all channels.
The 2026 trend is clear: the companies that invest in the fine measurement of their CAC by channel, diversification toward organic traffic and customer retention are building a gap that is increasingly hard to close. The others keep increasing their advertising budgets without understanding why each dollar returns less than before.
The levers are known, measurable and actionable: optimize your landing pages, invest in organic search, segment your audiences on your first-party data, reduce load time. None of these actions requires an additional budget. They require a rigorous diagnosis of your starting situation.
That is exactly what a marketing performance audit makes it possible to identify: your priority levers, the channels where your CAC is off the charts, and the conversion opportunities you are leaving on the table. Contact the Ursa Marketing team for an audit of your Google Ads campaigns and your search presence. Get a quantified diagnosis of your acquisition situation.
Frequently asked questions about customer acquisition cost
What is a good LTV/CAC ratio in 2026?
An LTV/CAC ratio of 3:1 is the minimum for a viable model: for every dollar invested in acquisition, the customer generates 3 dollars of revenue over their lifetime. In B2B SaaS, healthy companies aim for 4:1 to 5:1.
What is the difference between paid CAC and blended CAC?
Paid CAC calculates acquisition cost only on advertising channels (Google Ads, Meta Ads, LinkedIn). Blended CAC divides total marketing and sales spend by all customers, across all sources.
Is it better to invest in SEO or paid advertising to reduce your CAC?
Both channels are complementary, but their cost structure is radically different. Paid advertising (Google Ads, Meta) offers immediate results, but the CAC never drops: you pay for every customer. SEO involves a longer initial investment to pay off, but the CAC collapses over time as the content accumulates organic traffic.
What impact does Law 25 have on the CAC of Quebec companies?
Law 25 on the protection of personal information in Quebec has forced many companies to rework their ad tracking: cookie consent, server-side tracking implementation, revision of privacy policies. Companies that did not adapt their tracking saw the precision of their Meta and Google campaigns degrade, which drove up their CAC.